 Option Wheel Start
Featured Wheel example
Our wheel example with Mosaic MOS stock.
A real Wheel cycle from the first cash-secured put to the final sale of the shares.
- Underlying
- MOS
- Time in the Wheel
- 94 days
- Cash required
- USD $2,350
- Net profit
- USD $243.14
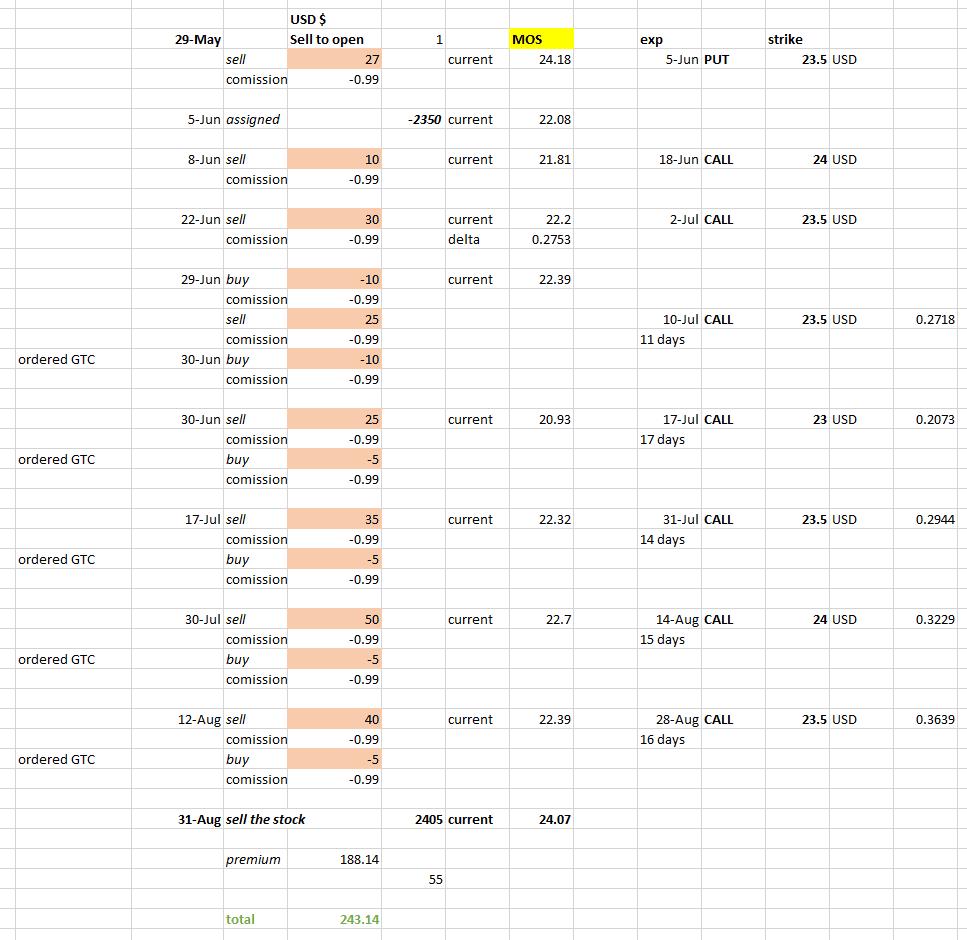
We started on May 29 by selling one MOS cash-secured put with a $23.50 strike and collecting a $27 premium. The put was assigned on June 5, so we bought 100 shares for $2,350. This was the cash required for the strategy.
We then sold covered calls while we held the shares. We sometimes bought a call back and sold another one with a later expiry. After the final call, we sold the 100 shares on August 31 for $2,405, which was $55 more than their cost.
The options produced $188.14 after the recorded costs. Adding the $55 gain on the shares gives a total profit of $243.14. Dividing $243.14 by the $2,350 cash required gives a 10.35% return over 94 days.
On a simple straight-line basis, that equals about $18.11, or 0.77%, per week and $77.60, or 3.30%, per 30-day month. Extending the same pace for 365 days would give us about $944.11, or 40.17% annually.
Featured Wheel example
My Summer Experiment With the Options Wheel Strategy
A real-money example that follows one cash-secured put, an assignment, several covered calls, and the eventual sale of the shares.
- Underlying
- ABX.TO
- Time in the Wheel
- About 12 weeks
- Maximum capital used
- CAD $5,600
- Net result
- CAD $374.13
During the summer of 2026, Andrew tested the Wheel with one stock and kept a record of every credit, debit, assignment, and commission. The position began with a $56 cash-secured put on ABX.TO. When the put was assigned, he bought 100 shares and moved into the covered-call phase.
A complete Wheel, not one winning trade
Over the following weeks, he sold several covered calls, closed some early, and rolled one call to a later expiration. The shares were eventually called away at $56, completing the cycle. The options produced CAD $387.00 before commissions and CAD $374.13 after commissions—a simple 6.68% return on the maximum capital used during the roughly twelve-week experiment.
The full article includes every stage of the position, the author's trade journal, what he learned about early closes and rolling, and the risks that remained throughout the experiment.